YSOs
Young Stellar Objects - Stars in the making
1. Review your understanding of the electromagnetic spectrum, especially visible light and infrared light.
2. Get a working understanding of ysos and the circumstellar disk that they sit in by reviewing the concepts below:
a. Quick overview of stellar evolution
c. Infrared Excess - nice animation of seds and different types of ysos
e. Photometry1 - a review of what photometry is **** Photometry2 - audio explanation of photometry and what it is and how it is done
f. Review of RA (right ascension) and dec (declination) - coordinates (an address) in the sky
3.Find out about the different telescopes & cameras from which we will get our data for each possible yso source. For each one listed, find the following:
A. What does the acromyn stand for? Is it a telescope, a camera or a survey (observing project over a certain timeframe)?
B. What wavelengths of light (which kind of light, what wavelengths) did this telescope/project observe in?
C. Are observations still being taken or is the telescope/project done? If finished, how long did the project run for?
2MASS - the Two Micron All-Sky Survey
WISE - Wide-field Infrared Survey Explorer
Spitzer - IRAC - the Infrared Array Camera on the Spitzer Space Telescope
Spitzer - MIPS - the Multiband Imaging Photmeter on the Spitzer Space Telescope
4. Start an Excel spreadsheet. You can start it in Google Docs but eventually you will probably have to download it as an excel doc and use it in Excel, espically when making SED diagrams. You will have at least three parts - Image notes, photometry lists & unit conversion, wavelength information, Spectral Energy Diagrams (SED - spectral for the spectrum, energy for flux).
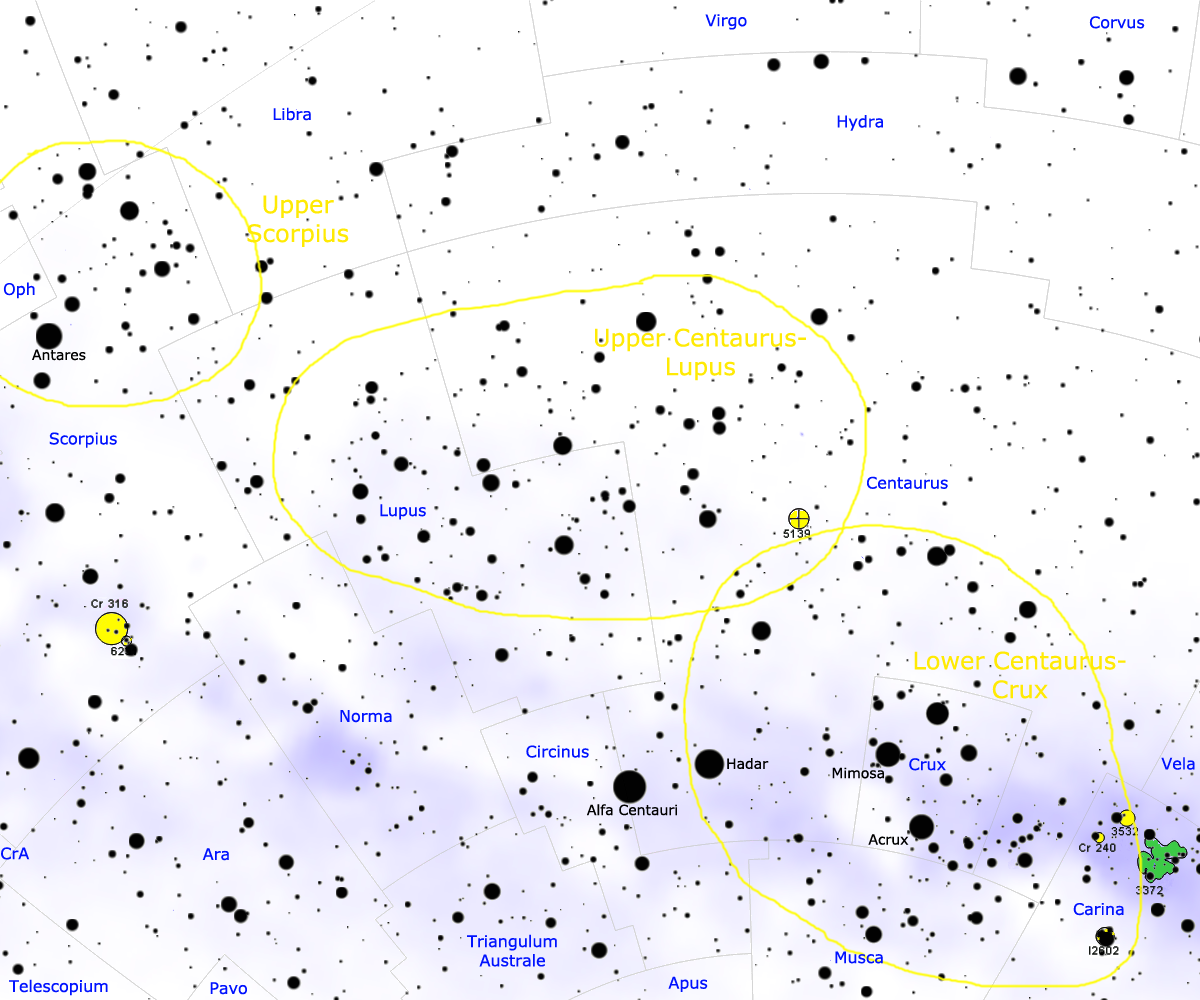
5. Get locations of possible yso sources from the Song Paper. You need the RA and Dec. There are three sections of the Scorpius Centaurus OB Association. Lower Centaurus Crux (LCC #1-#71); Upper Centaurus Lupus Region (UCL #72-#87); Upper Scorpius (US #88-104)
6. Check a picture of each source in the NASA/IPAC catalog to make sure there is actually a source at the that location. Sometimes computers make mistakes and you have to double check. You have to check two websites to get images from each of the telescopes/cameras. Keep notes of what you find in your excel spreadsheet.
2MASS, SDSS, DSS - Type in the location as it is listed in the Song paper. If you get a message saying "RUNNING:Execution time so far" just give the site a few minutes and you should get a result.
WISE - You can look at WISE images here. Just type in the coordinates and hit the search button.
7. When you are sure each source is actually a source it is time to collect data. Again there are two sites to get data from. Don't use Internet Explorer for this.
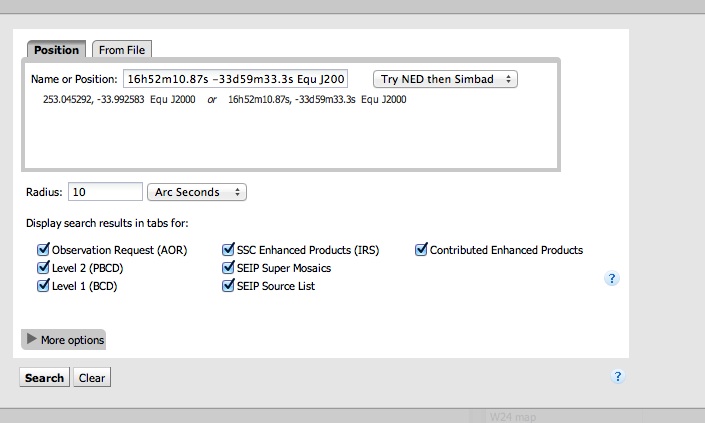
SHA (Spitzer Heritage Archive) - You can get photometry from several projects here. Type in the location. Start with a 5 arcsec radius. Make sure all the boxes are checked like the picture below. Click Search.
The resulting webpage will have several tabs which give you different information. The first result you see are the AORs - the Astronomical Observation Requests that included the part of the sky you requested. On the side, under the Details tab, you'll see the project who requested the image, the astronomer who was incharge of the project (PI - Principal Investigator) and a description of the project. You can look at the other tabs but the one we are interested in the most is the Source List tab. Click on it and if you see more than one line go back to the search page and use a smaller radius. You want to zero in on your location and not other sources that may be close by.
Look for the following columns and record the magnitudes or fluxes you find for each wavelengths. Review of telescopes/cameras and the wavelengths they take images in.
I1_F_Ap1 - IRAC Ch1 flux density - unit uJy - [if you will be including error bars then also get I1_dF_Ap1 - IRAC Ch1 flux density uncertainty - uJy]
I2_F_Ap1 - IRAC Ch2 flux density - uJy - [I2_dF_Ap1 - IRAC Ch2 flux density uncertainty - uJy]
I3_F_Ap1 - IRAC Ch3 flux density - uJy - [I3_dF_Ap1 - IRAC Ch3 flux density uncertainty - uJy]
I4_F_Ap1 - IRAC Ch4 flux density - uJy - [I4_dF_Ap1 - IRAC Ch4 flux density uncertainty - uJy]
M1_F_PSF - MIPS Ch1 PSF fit flux density - uJy [M1_dF_PSF - MIPS Ch1 PSF fit flux density uncertainty - uJy]
J - 2MASS J flux density - uJy [dJ - 2MASS J flux density uncertainty - uJy]
H - 2MASS H flux density - uJy [dH - 2MASS H flux density uncertainty - uJy]
K - 2MASS K flux density - uJy [dK - 2MASS K flux density uncertainty - uJy]
WISE1 - WISE W1 flux density - uJy [dWISE1 - WISE W1 uncertainty - uJy]
WISE2 - WISE W2 flux density - uJy [dWISE2 - WISE W2 uncertainty - uJy]
WISE3 - WISE W3 flux density - uJy [dWISE3 - WISE W3 uncertainty - uJy]
WISE4 - WISE W4 flux density - uJy [dWISE4 - WISE W4 uncertainty - uJy]
A. Units of Spitzer (SHA) photometry is in microJanskys (uJy) which is a flux (an energy amount per area per unit of time - energy/area/time).
B. Flux density is like flux except you are adding the type of energy (which kind of light) - energy/area/time/photon
C. Spitzer uses Janskys - 1 Jy = 10^-23 erg/s/cm^2/Hz. We will have to do some conversions of units.
D. There are four steps we have to go through to get our uJy into units we want to plot.
1. Turn uJy into Jy. 1 Jy = 10^6 uJy (1Jy/1000000uJy) - So divide your photometry from Spitzer by 10^6. [Fλ]
2. Turn Jy into cgs units (cgs = centimeter gram seconds units). 1 Jy = 10^-23 erg/s/cm^2/Hz - So multipy your answer in #2 by 10^-23. [Fλ]
3. Turn the cgs number into flux density by multiplying your answer in #3 by (the speed of light/the wavelength of the light in cm squared). The speed of light is c (3x10^10 cm). The wavelength for the filter you are working with should be the zero point of that wavelength in cm. The number you get is the flux density this yso (the source) emitted for that particular wavelength.
4. Since these numbers are so small (around 10^-12) it can be hard to compare them and see any differences. So to make it easier we use the Log of the flux.
9.